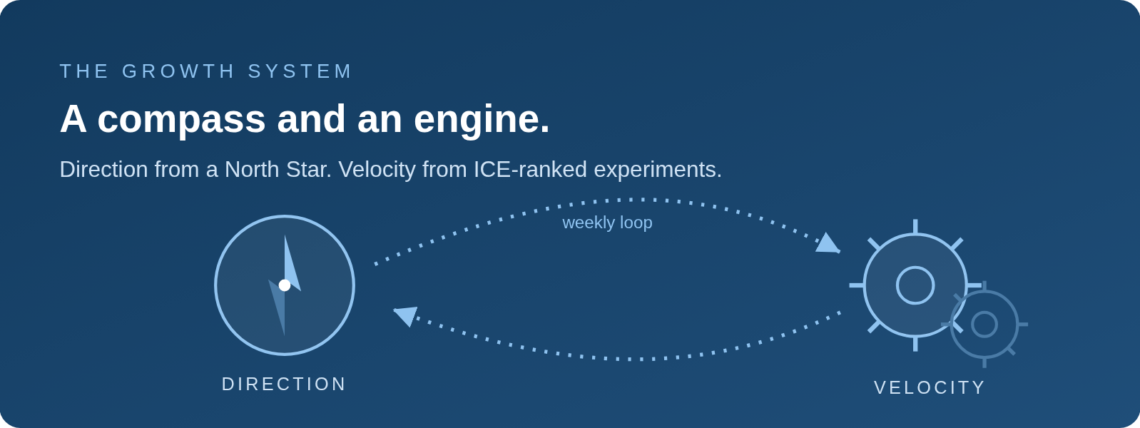
My first startup sold furniture online. We tried every growth trick going — and most worked exactly once. What finally moved the needle wasn’t a hack. It was a system. Here’s the North Star + ICE + Weekly Loop framework I’ve rebuilt across 18 years, cut to two parts you can stand up in 30 days.
TL;DR — THE WHOLE FRAMEWORK IN 60 SECONDS
- North Star Metric: One number that captures real customer value (not vanity, not revenue). Break it into 3-5 input levers your team can actually pull.
- ICE Scoring: Score every experiment on Impact (1-10), Confidence (1-10), Ease (1-10). Average them. Run from the top.
- Weekly Loop: Same 45-min meeting every week — review metrics, call verdicts on tests, pull next experiments from the ICE stack.
- The result: A machine that gets smarter every week. Not a trick that works once.
Table of Contents
My first startup was MebelKart, a furniture marketplace. In the early days, I did growth on instinct.
One week it was a flash sale. The next, a referral offer. Then influencer seeding. Then a discount. Then whatever a competitor had just tried.
Some of it worked. None of it kept working. And I could never tell you why.
What turned it around wasn’t a clever tactic. It was almost dull.
We picked one number that told us whether customers were actually getting value — repeat buyers, not signups — and pointed everything at it.
Every week, we looked at that number. We killed what didn’t move it. We doubled down on what did.
Growth stopped being a run of lucky guesses. It started to compound. That habit — not any single hack — is what I’ve used in every company and client since.
Because here’s the truth: founders who build growth that lasts rarely win on one tactic. They win because they built an engine — a repeatable way to aim effort at the right target and turn it into learning, fast.
The hack was never the referral loop. It was the process that found it.
What I landed on is simple. Two parts: a compass and an engine.
The compass is a North Star metric that tells you which way is up. The engine is a prioritized experiment loop (scored with ICE) that gets you there as fast as you can run. Wire them together with a weekly rhythm and it holds whether you’re solo or a team of forty.
Let me walk you through it.
Why Most Growth Work Goes Nowhere
Before the framework, let’s be honest about the mess it exists to clean up: random acts of marketing.
You’ve seen it. Monday, somebody reads a thread about a startup that 10x’d with a waitlist. Tuesday, the team is building a waitlist. Wednesday a competitor ships an AI feature and the roadmap lurches. Thursday the founder saw a LinkedIn post about SEO, and now everyone’s arguing about blog cadence. Nothing gets a fair test. Nothing is measured against a shared idea of what “working” even means. Effort is sky-high, learning is basically zero, and six months later the honest answer to “what did we learn about our growth?” is a shrug.
It comes down to three gaps, and this framework plugs each one:
- No shared direction. With no single metric everyone agrees on, every idea sounds equally good, so the loudest person in the room wins. The North Star fixes this.
- No prioritization. A hundred ideas and no way to rank them means you default to whatever’s easiest or newest. ICE fixes this.
- No memory. Experiments never get written down, so the same arguments come back every quarter and wins never stack up. The weekly loop fixes this.
Growth isn’t a stunt you pull. It’s a system you run.
The Framework at a Glance
Two halves, joined by one loop.
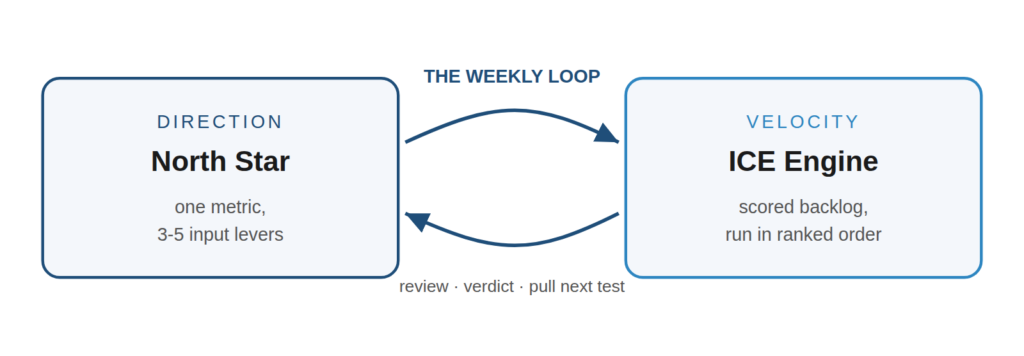
That’s genuinely it. Everything below is how to do each part well, because the gap between a growth system that compounds and one that stalls lives entirely in the details.
Part 1 — The North Star Metric (Your Compass)
Your North Star metric is the one number that best captures the value customers get from your product. Not the money you pull out. The value they get. Nail this and everything downstream gets easier, because now every argument about what to build or test collapses into one question: does it move the North Star?
What makes a North Star metric strong? The 4-check test
A strong North Star passes four checks:
- It reflects customer value, not vanity. “Pageviews” is vanity. “Weekly active teams that sent at least one message” is a team getting real value.
- It leads revenue instead of being revenue. Revenue is the lagging scoreboard. Your North Star is the thing that, when it climbs today, drags revenue up later.
- It’s one number. The second you have three North Stars, you have none. A team can only really optimize for one thing at a time.
- Your team can actually move it. If nothing you could ship this quarter would budge the metric, it sits too far downstream to steer by.
North Star metric examples by product type
| Product type | Weak (vanity) | Strong (value-based North Star) |
|---|---|---|
| Team collaboration tool | Total signups | Weekly active teams doing the core action |
| Marketplace | Registered users | Successful transactions per week |
| Content / media | Pageviews | Weekly returning readers |
| B2B SaaS (PLG) | Free trials started | Accounts that hit the activation milestone |
| AI analytics tool | Logins | AI queries resolved per active workspace |
| Developer tool / API | API calls | Monthly active integrations in production |
Look at the shape of the strong ones. Each has an active qualifier (they came back), a unit (user, team, account), and a value action (they did the thing your product exists to do). That’s the recipe. If your metric is missing one of those three, it’s probably vanity wearing a nicer outfit.
Break it into levers you can actually pull
A North Star you can’t break apart is just a fancier vanity number. The real power shows up when you split it into the 3-5 inputs that actually drive it. I think of it as the North Star tree, and it’s what turns a lofty metric into an actual to-do list.
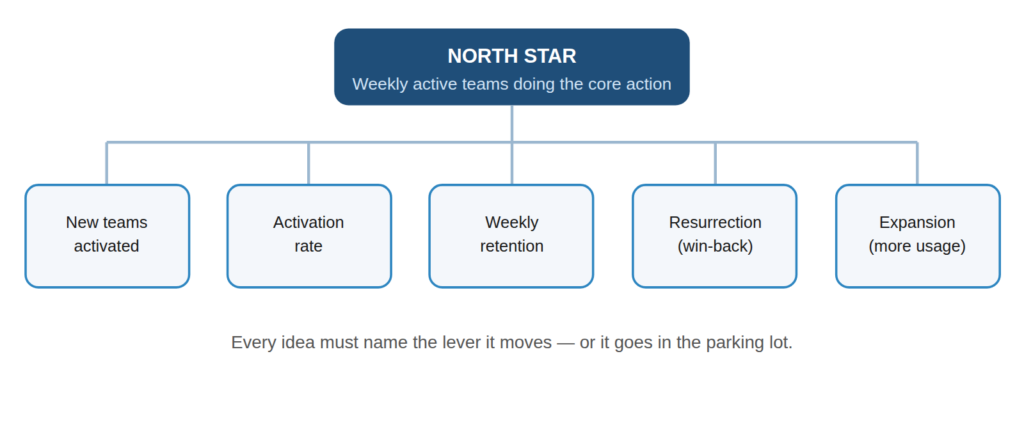
Say your North Star is “weekly active teams doing the core action.” That number is driven by things like: how many new teams reach the value action for the first time, what share of signups ever activate, how many activated teams come back and act again, how many dormant teams you win back, and how much your active teams expand usage. Five levers. Now “grow the North Star,” which is impossibly vague, becomes five concrete places to push.
The lever test: When someone pitches an idea, stop asking “is this good?” and start asking “which lever does this move, and roughly how much?” Ideas that don’t map to a lever get parked. That one reflex kills most of the busywork that eats growth teams alive.
Don’t confuse three things. Your North Star isn’t your mission, and it isn’t revenue. A mission (“democratize X”) is a direction for the decade; you can’t review it on a Tuesday. Revenue is the scoreboard. The North Star sits in between: a number your team can actually move this month, that pulls the scoreboard up behind it.
Part 2 — The ICE Engine (Your Velocity)
The compass tells you where up is. The engine is how fast you climb. And there’s a little mental model that reframed growth for me years ago:
Growth output ≈ number of experiments × win rate × average impact of a win.
Sit with those three factors for a second. You can’t reliably control your win rate. Even excellent teams are wrong most of the time, and a 20-30% hit rate is perfectly normal. You can’t fully control the impact of any single win either; some tests just surprise you. The one thing you genuinely control is how many good experiments you run. Volume is the lever you own.
A team running four solid experiments a week will out-learn a team running four a quarter every single time, and not because they’re smarter. They just get more shots and more learning per week.
So the engine has exactly one job: turn ideas into scored, ranked, running experiments with as little friction as possible.
Step 1: Make every idea a testable hypothesis
An idea sounds like “we should try a referral program.” A hypothesis is something you can actually test:
Because activated teams already invite coworkers by hand, we think adding a one-click invite at the activation moment will lift new-team activation by around 10%. We’ll know by comparing two-week activation between the variant and the control.
That format — Because [insight], we think [change] will move [metric] by [amount], measured by [method] — forces you to name the lever, the expected size, and the measurement before anyone builds a thing. Honestly, half of your bad experiments die right here, the moment you realize you can’t even measure the outcome. That’s the format doing its job.
Step 2: Score it with ICE (created by Sean Ellis)
ICE is three questions, each scored 1-10, then averaged. It was created by Sean Ellis, the person who coined the term “growth hacking” and helped companies like LogMeIn and Dropbox scale their growth teams.
| Factor | What it measures | Low (1-3) | Mid (4-6) | High (7-10) |
|---|---|---|---|---|
| Impact | How much this will move your target metric? | Negligible lift expected | Moderate, measurable lift | Significant, data-backed lift |
| Confidence | How sure are you it will work? | No data, pure gut feel | Some data or precedent | Strong data, prior wins |
| Ease | How quickly can you ship it? | Weeks of engineering, complex | Medium effort, some dependencies | Can ship in days, minimal dependencies |
ICE Score = (Impact + Confidence + Ease) ÷ 3
Score honestly, score fast. You’re not chasing a perfect ranking. You want a good-enough one in minutes so you can get back to running experiments.
Real ICE scoring example: three competing ideas
| Experiment | Impact | Confidence | Ease | ICE Score | Verdict |
|---|---|---|---|---|---|
| One-click invite at activation moment | 7 | 7 | 8 | 7.3 | ✅ Run first |
| Rebuild entire onboarding flow | 9 | 5 | 2 | 5.3 | ⏸️ Park for later |
| Add progress checklist to empty state | 5 | 8 | 9 | 7.3 | ✅ Run in parallel |
Notice what the scoring surfaces. The “rebuild onboarding” idea has the highest ceiling on impact and the lowest score, because it’s a slow, low-confidence moonshot. The two boring, cheap, high-confidence tests win. Which is exactly right early on. You want a stack of fast, confident tests to build momentum and learning, not one giant bet that swallows a quarter.
Why ICE works: It defuses the HiPPO problem (when the founder’s pet idea scores a 3.7, it’s the number arguing, not the intern). It makes trade-offs visible. And it’s fast — scoring twenty ideas takes half an hour; arguing about twenty ideas with no rubric takes a week and settles nothing.
Part 3 — The Weekly Loop (Where Compass Meets Engine)
A compass with no engine is a nice poster on the wall. An engine with no compass is a fast car with no steering. The loop is what fuses them, and it runs on a weekly beat. If you take one thing from this whole piece, take this part, because it’s the difference between teams that have a growth process and teams that just talk about having one.
The weekly growth meeting: 45 minutes, 3 moves
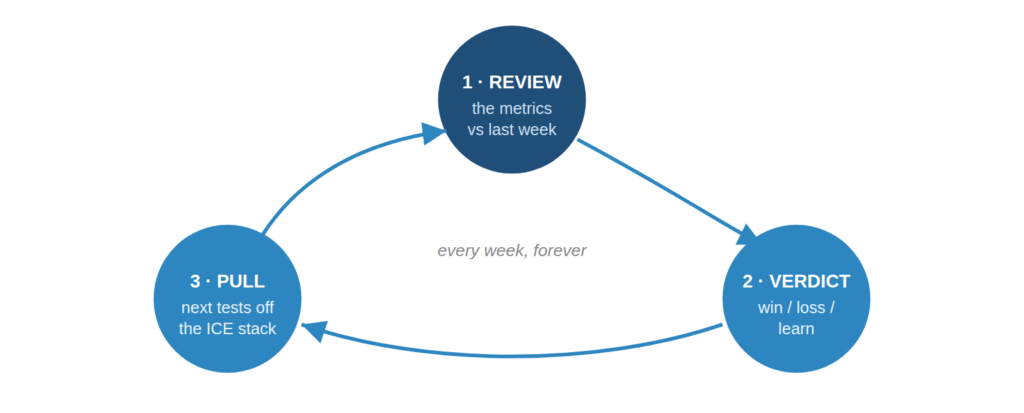
Once a week, same time, 45-60 minutes, three agenda items in this order:
- Review the metrics. Look at the North Star and its levers against last week. Not to celebrate or panic — just to notice. Which lever moved? Which one flatlined? This is where next week’s target reveals itself.
- Call verdicts on last week’s tests. Every running experiment gets one: win, loss, or inconclusive. Then — and this is the part people skip — you write down what you learned, not just what happened. A loss that teaches you “our users genuinely don’t care about X” can be worth more than a win you can’t explain.
- Pull the next experiments. Take the top of the ICE backlog, put a name and a start date on each one, and go. Every experiment walks out of that room with an owner. Ownerless experiments don’t run. They just don’t.
Metric, verdict, next test. Every week. That sounds almost too dull to call a “framework.” The dullness is exactly the moat. Anyone can run one clever campaign. Very few teams can run this loop, honestly, for a hundred weeks straight, and the ones who pull it off end up somewhere the campaign-chasers never reach.
The four ways an experiment can end
| Outcome | What it means | What you do next |
|---|---|---|
| Clear win | Metric moved, and you trust the read | Ship it for good, then ask how to amplify it |
| Clear loss | No effect, or worse | Kill it, write down why you think it failed, move on fast |
| Inconclusive | Can’t tell — too little traffic or time | Run it longer, redesign for a cleaner read, or drop it |
| Surprise | Didn’t move the target, moved something else | Chase the surprise. Some of the best discoveries hide here |
Write it all down — this is where compounding hides
Every experiment, its hypothesis, its ICE score, its result, and its lesson, goes into one document. Call it a growth wiki, a Notion database, a scrappy spreadsheet — whatever you’ll actually keep. The tool doesn’t matter. That it exists matters enormously.
A growth system’s real asset was never any single winning test. It’s the slowly accumulating understanding of what does and doesn’t work for your specific customers. A year in, a team that writes things down can answer “have we tried X?” in ten seconds, and “why did it flop?” right after. A team that doesn’t re-argues the same idea every few months, and every new hire starts from scratch. Your written record is what turns 52 weeks of scattered experiments into a knowledge base that’s genuinely hard to copy, because a competitor would have to live through your two years of tests to rebuild it.
Standing It Up in 30 Days: A Step-by-Step Playbook
You don’t need permission or a big team to start. Here’s the four-week version:
Week 1 — Set the compass. Agree on one North Star and sketch its tree of 3-5 levers. Make sure you can actually measure the metric and each lever. If you can’t yet, congratulations — your first experiment is instrumenting it.
Week 2 — Build the engine. Dump every growth idea you and the team have. Aim for 20-30. Turn each into a one-line hypothesis tied to a lever. Score them all with ICE. Rank.
Week 3 — Run. Launch your top two or three. Give each an owner. Resist the itch to also kick off five more; velocity comes from finishing, not from starting.
Week 4 — Close the loop. Hold the first real weekly meeting. Review the metric, call verdicts, write the lessons, pull the next batch. You now have a running system.
By day 30 you won’t have growth-hacked your way to a hockey stick, and anyone promising you that in a month is selling something. What you’ll have is better: a machine that gets a little smarter every week you keep it running.
The 7 Ways This Framework Quietly Dies
I’ve watched this framework fail, and it almost always dies the same handful of ways. Guard against these:
- Chasing tactics instead of levers. Copying a competitor’s hack without asking which of your levers it even touches. Tactics are borrowed. Levers are yours.
- Testing trivial stuff. Fiddling with button colors while your activation rate sits at four percent. Match the size of the experiment to the size of the problem.
- No owner. “The team” owning an experiment means nobody owns it. One name per test.
- Skipping the write-up. The single most common reason growth stops compounding. Undocumented learning just evaporates.
- Quitting the system instead of the tactic. One bad month, and people ditch the whole loop. But the loop didn’t fail. A few experiments did, which is the loop working exactly as designed. Kill tactics freely. Protect the system.
- Optimizing a vanity North Star. If your North Star isn’t tied to real value, this machine will efficiently and cheerfully drive you off a cliff. Get the compass right first.
- Running the meeting without an agenda. The weekly loop collapses into status updates the moment you stop enforcing the three-move structure. Review, verdict, pull. Nothing else.
Why This Compounds When Tricks Don’t
Here’s what nobody tells you about the hack mindset: even when a hack works, it’s a one-time payout. You pulled the lever, you got the bump, and now you need a new hack. It’s a treadmill, and it speeds up as you scale.
A system behaves differently:
- A North Star keeps a growing team pointed the same way without someone hovering over every decision.
- A ranked backlog turns “what should we do?” from a weekly fight into a two-minute look at a list.
- A weekly loop converts raw effort into learning at a steady, dependable rate.
- A written record makes that learning permanent, so year two picks up where year one left off instead of starting cold.
None of those four things is clever, and that’s the whole reason they last. Cleverness gets copied over a weekend. A two-year-deep read on your own customers, built one written-down experiment at a time, does not.
If there is a real growth hack — the only one that’s held up for me across 18 years and a lot of very different products — it’s this: run a boring, relentless system while everyone else is out chasing the next trick.
So pick your North Star this week. Draw the tree. Dump twenty ideas and score them. Book the meeting. The system starts the moment you run the loop once, and it only gets stronger from there.
Frequently Asked Questions
What is a North Star metric in growth hacking?
A North Star metric is the single number that best captures the value customers get from your product. It reflects customer value (not vanity), leads revenue instead of being revenue, is one number your team can optimize for, and is something your team can actually move within a quarter. For a team collaboration tool, a strong North Star would be “weekly active teams doing the core action” rather than “total signups.”
What does ICE stand for in growth hacking?
ICE stands for Impact, Confidence, and Ease — the three factors created by Sean Ellis (who coined “growth hacking”) to score and rank growth experiments. Impact = how much the experiment will move your target metric. Confidence = how sure you are it will work (based on data, past tests, customer research). Ease = how cheap and fast it is to run. Each is scored 1-10 and averaged to get the ICE score.
How do you run a weekly growth meeting?
A weekly growth meeting has three agenda items in this order: (1) Review the metrics — look at the North Star and its levers against last week. (2) Call verdicts on last week’s tests — win, loss, or inconclusive, plus what you learned. (3) Pull the next experiments — take the top of the ICE backlog, assign owners, and set start dates. Every experiment walks out with an owner. Ownerless experiments don’t run.
How long does it take to set up a growth hacking framework?
You can stand up this growth framework in 30 days: Week 1 — set the compass (agree on one North Star and 3-5 input levers). Week 2 — build the engine (dump 20-30 ideas, turn each into a hypothesis, score with ICE, rank). Week 3 — run (launch top 2-3 experiments with owners). Week 4 — close the loop (hold first weekly meeting: review metrics, call verdicts, write lessons, pull next batch).
What is the difference between growth hacking and traditional marketing?
Growth hacking is a system of rapid, data-driven experimentation across the entire customer journey (acquisition, activation, retention, revenue, referral) to find scalable growth channels. Traditional marketing typically focuses on planned campaigns with longer timelines and broader brand awareness. Growth hacking prioritizes speed, measurement, and learning; traditional marketing prioritizes consistency and reach. The best teams use both.
Can a solo founder use this framework?
Yes. The framework scales from one person to forty. A solo founder’s North Star might be simpler, their ICE backlog shorter, and their weekly loop a 20-minute solo review. But the mechanics are identical: one metric, scored experiments, weekly rhythm. I’ve seen solo founders out-learn teams of ten simply because they ran the loop consistently.
What tools do you recommend for documenting growth experiments?
Start with whatever you’ll actually use. A simple Notion database or Google Sheet with columns for: Experiment ID, Hypothesis, Lever, ICE Score, Owner, Start Date, End Date, Result, Verdict, Lesson. As you scale, dedicated growth experiment tools like Growth Method or Amplitude Experiment can add structure. The key is that the tool doesn’t matter — the habit of writing things down does.

